pipescan
See where your CI/CD spends wastes time
pipescan turns the GitHub Actions runs of your repositories into timelines and trends. Find the job that slows down every build, the step that keeps failing and the workflow that burns your minutes.
Free during the beta: 1 repository and its last 30 days of runs. What's included. The demo has sample data and needs no sign-up.
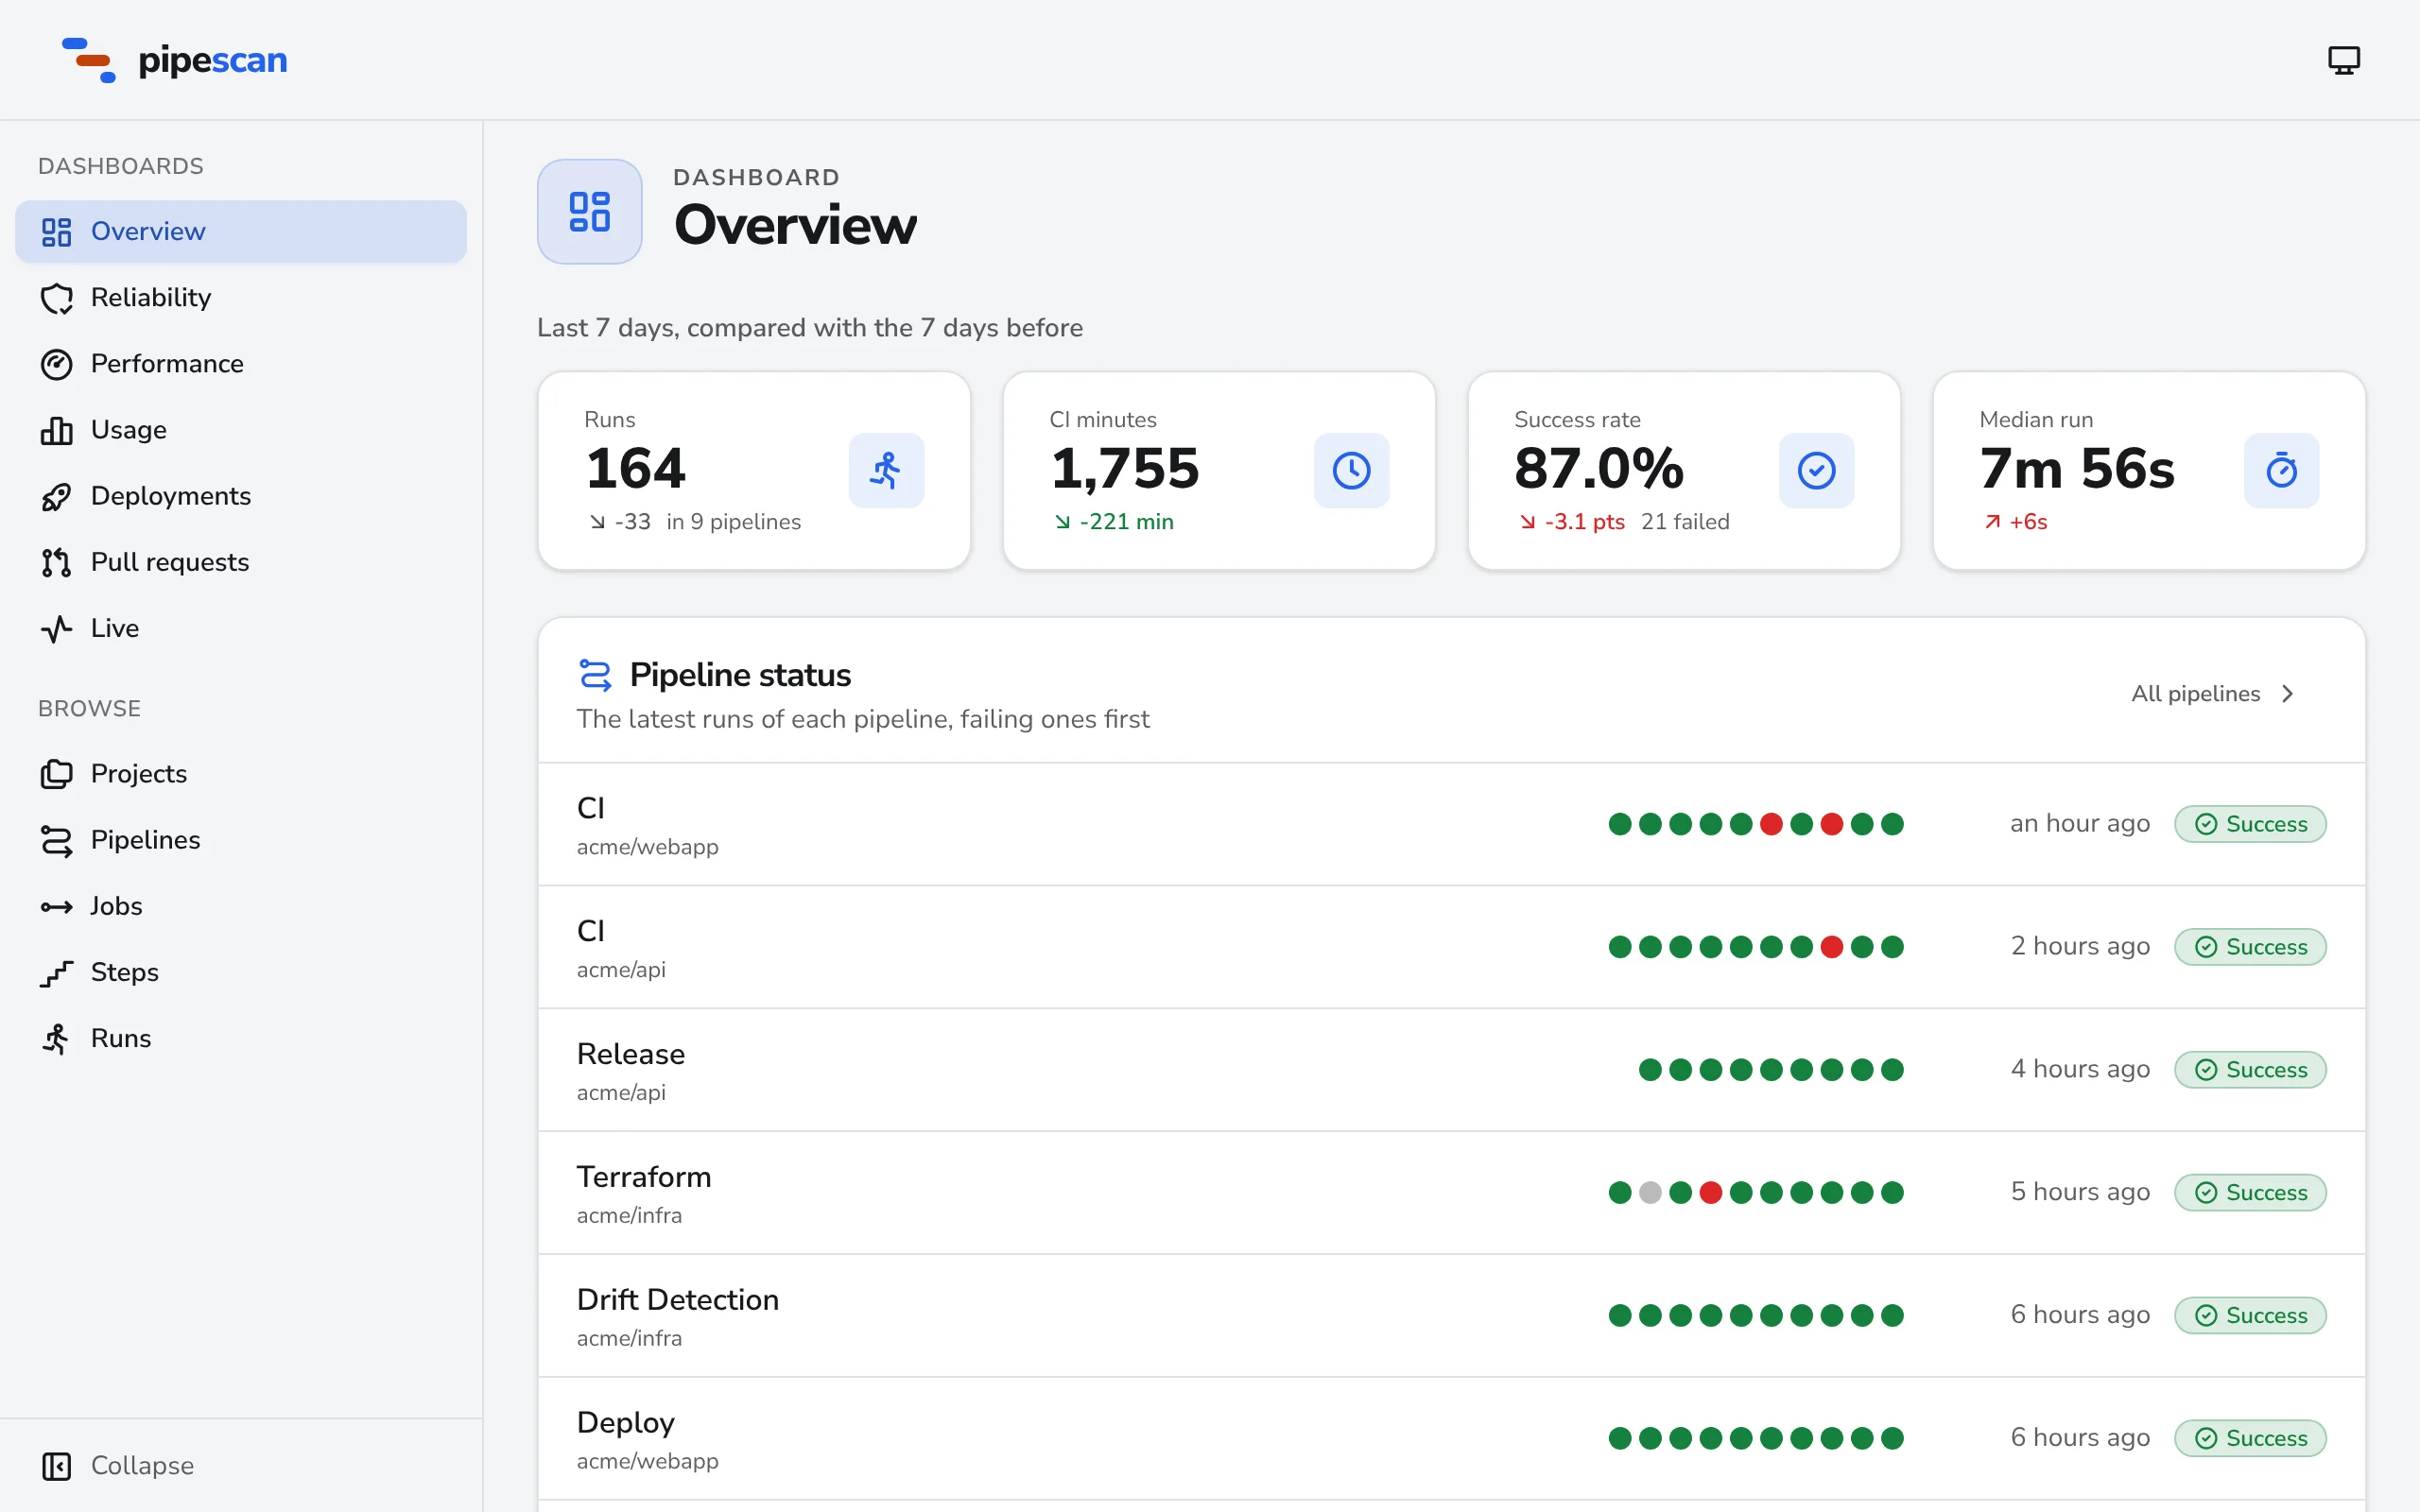
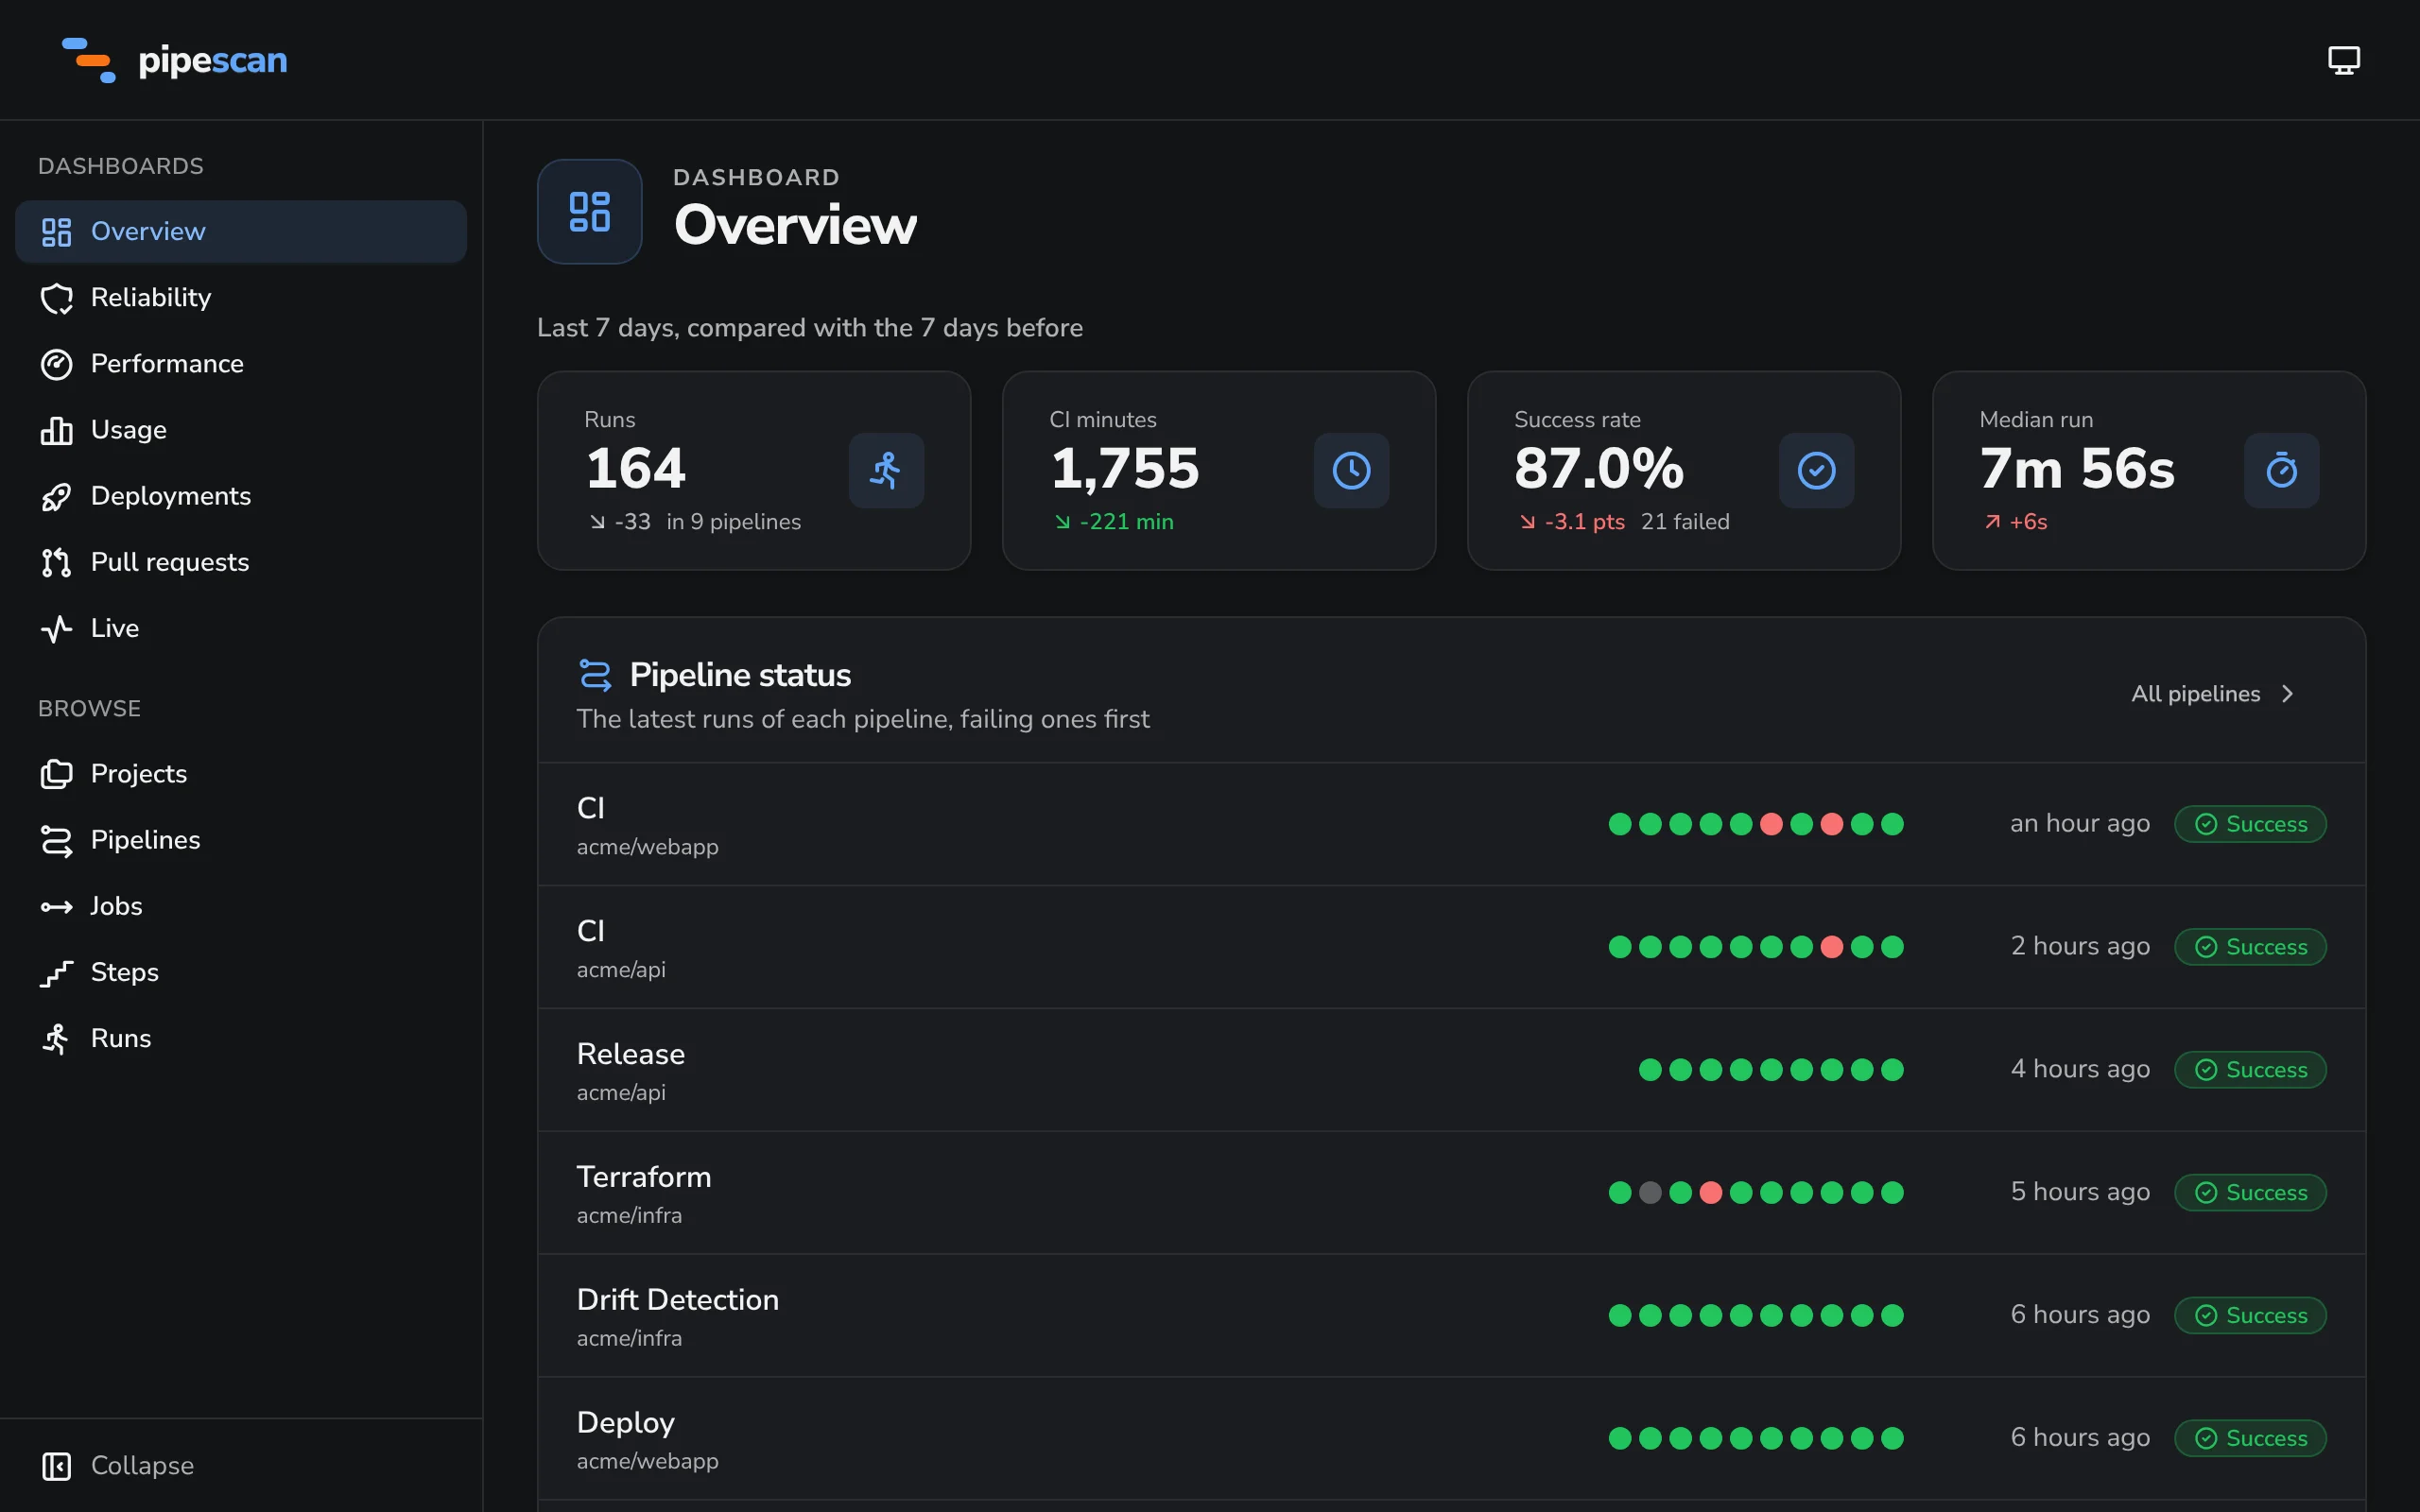
Pipeline Insights
Stop guessing where your pipeline time goes
A slow pipeline costs you twice: in CI minutes, and in everyone waiting for a green check. pipescan shows you where to start.
Run timeline
Find the step that holds up every run
Each run is laid out on one time axis, job by job and step by step, live while it runs. The critical path shows which jobs decided when the run finished, so you know which one to make faster first.
- Jobs and steps on a shared time axis
- The critical path and the time spent waiting for a runner
- Runs in progress update live
- Critical path
- Other jobs
- Steps
- Waiting for a runner
Pipeline history
Know if your pipeline gets faster or slower
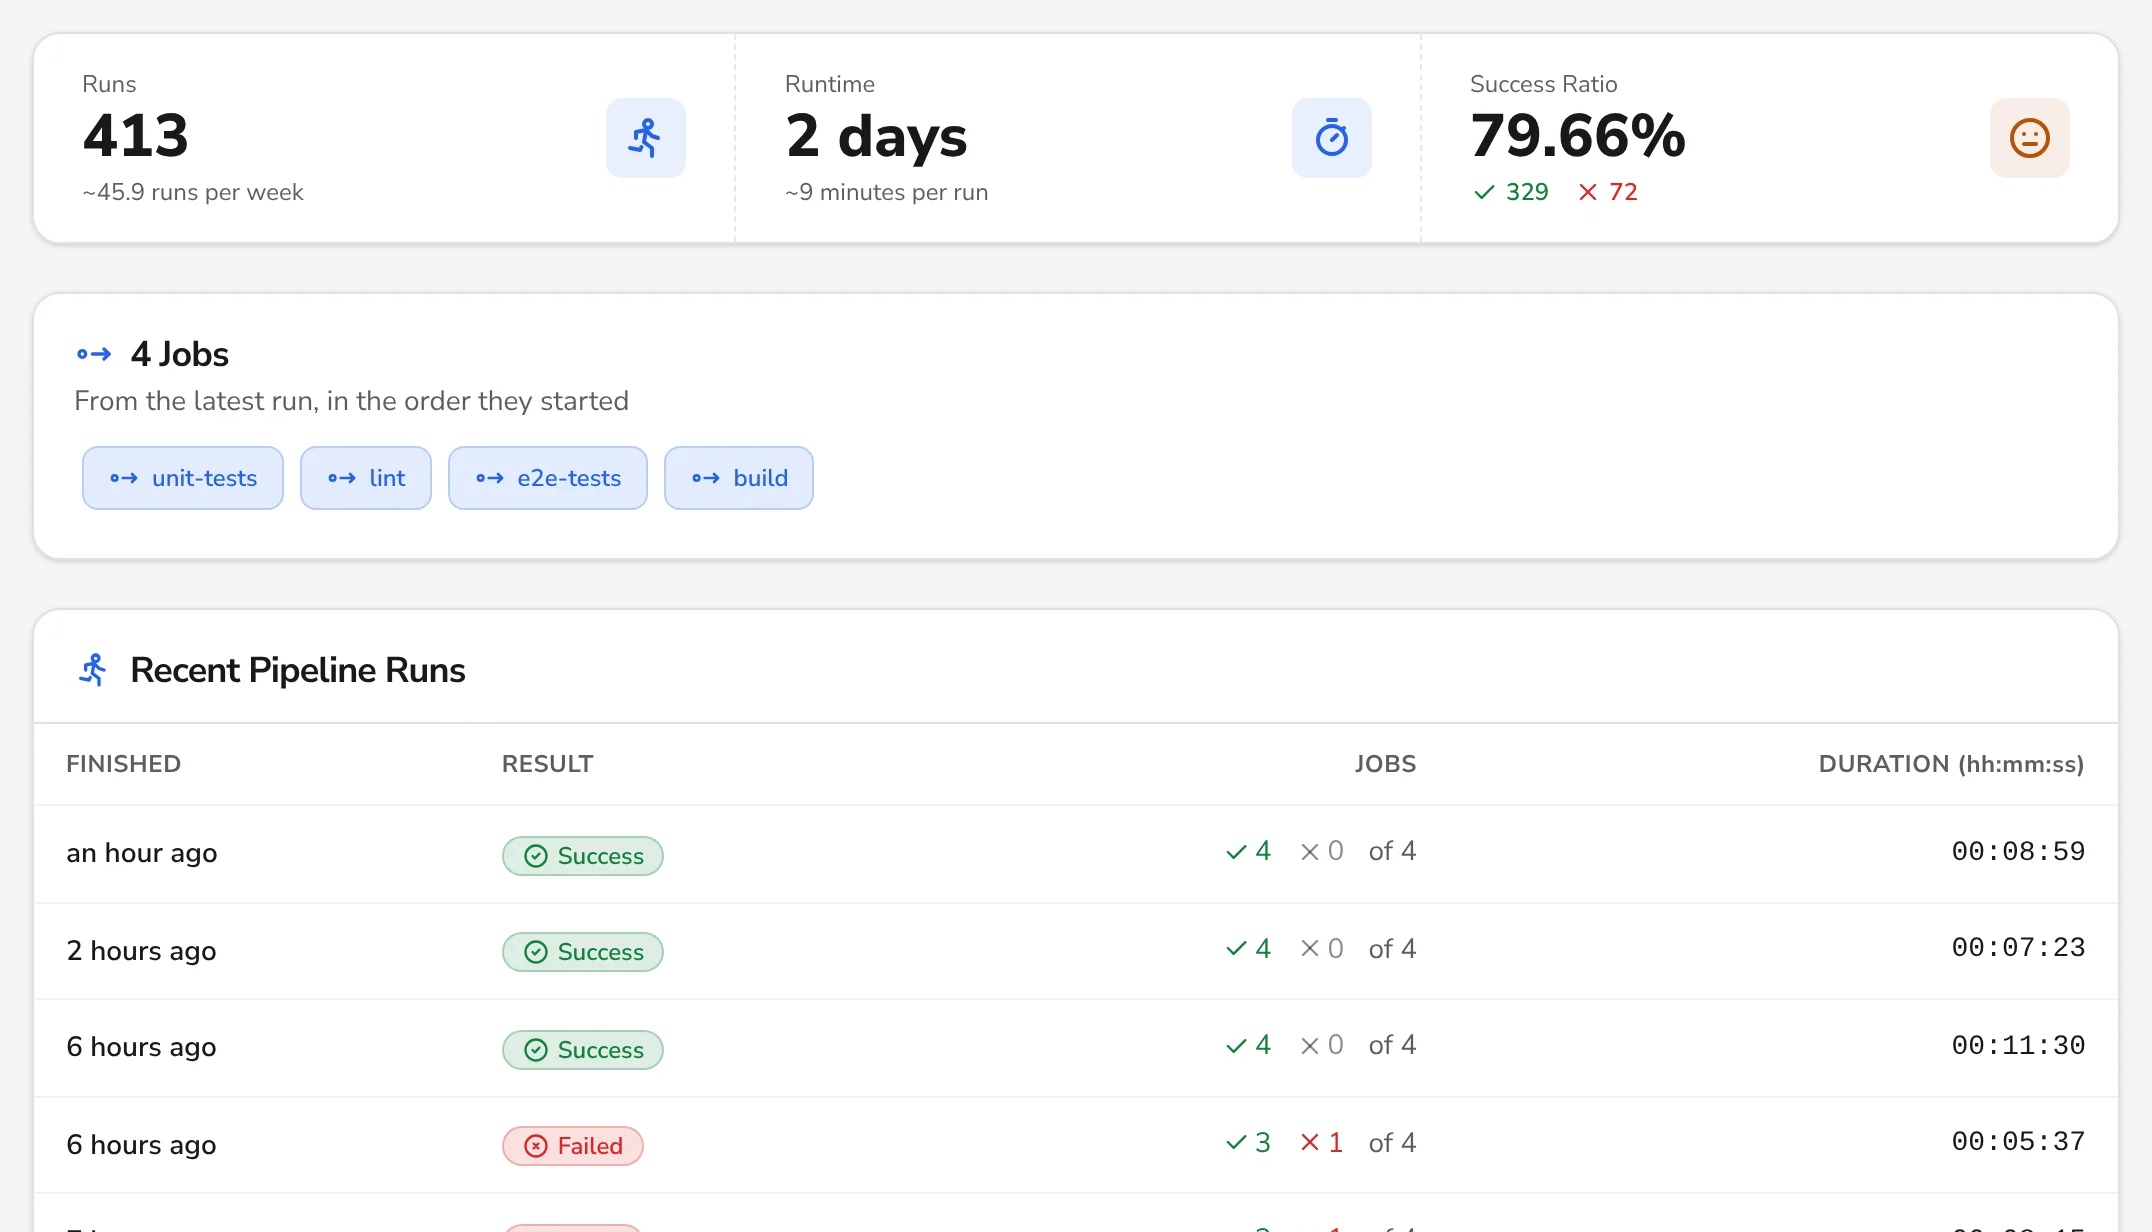
Every pipeline, job and step keeps its history: how often it runs, how long it takes and how often it fails. So you see whether the cache you added last week paid off.
- Runs per week, average runtime and success ratio
- History down to a single step
- The duration of every past run
Trends
Spot a trend before it costs you
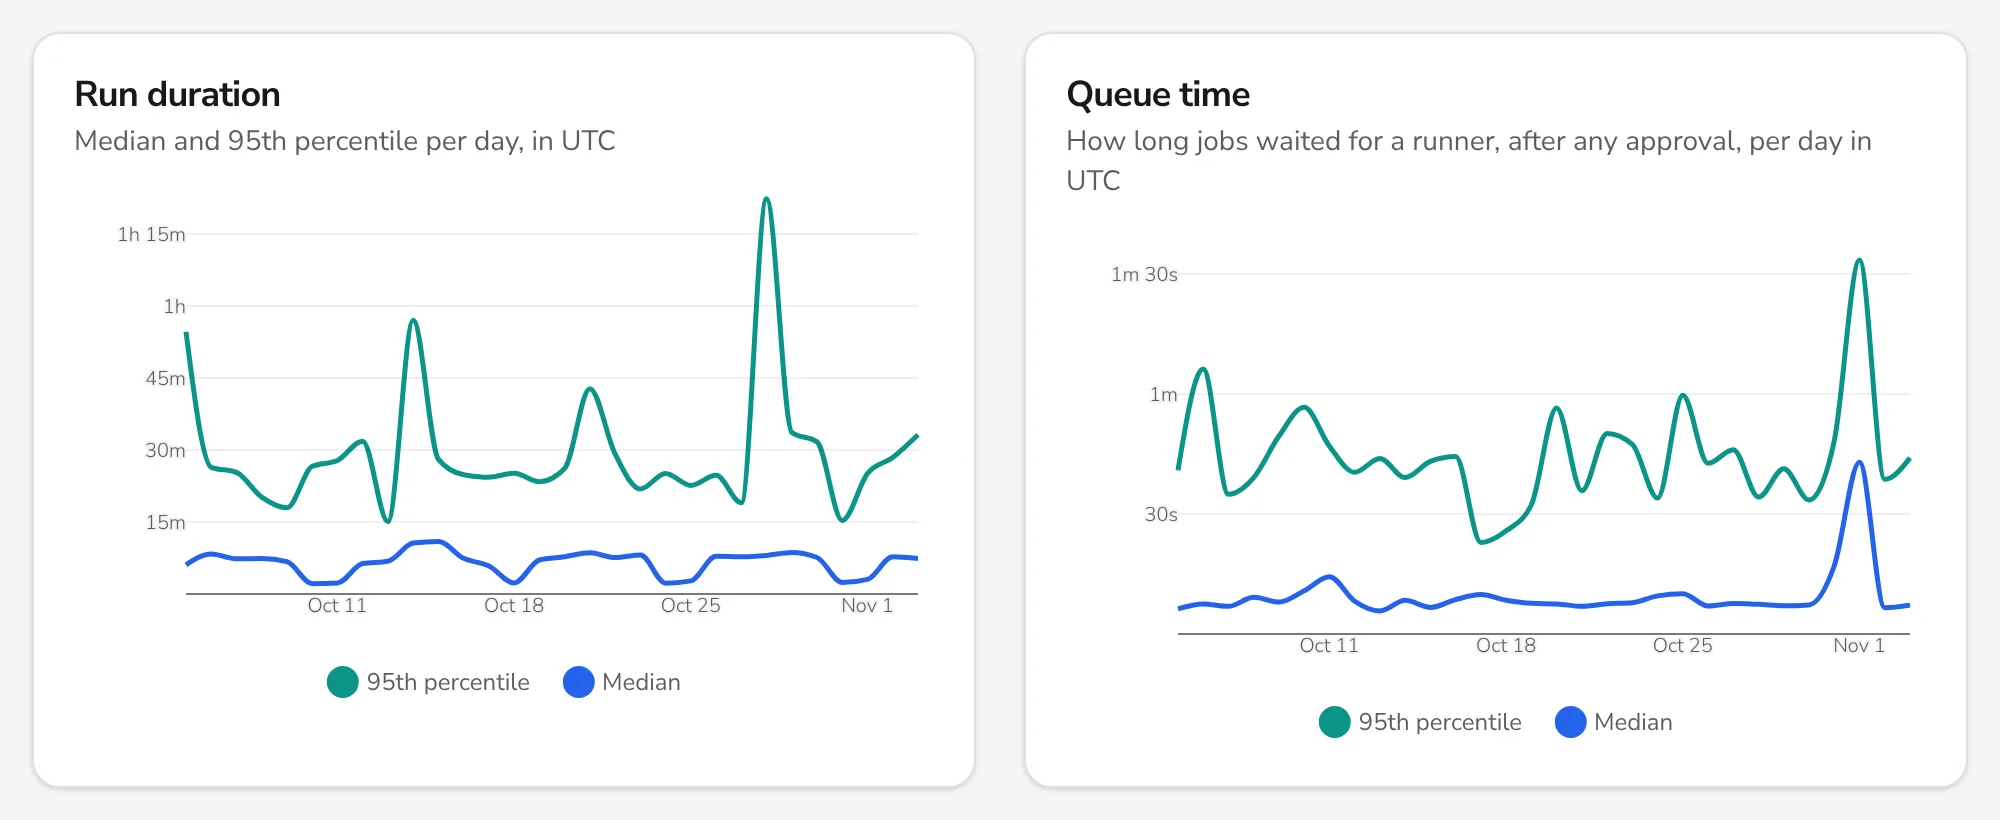
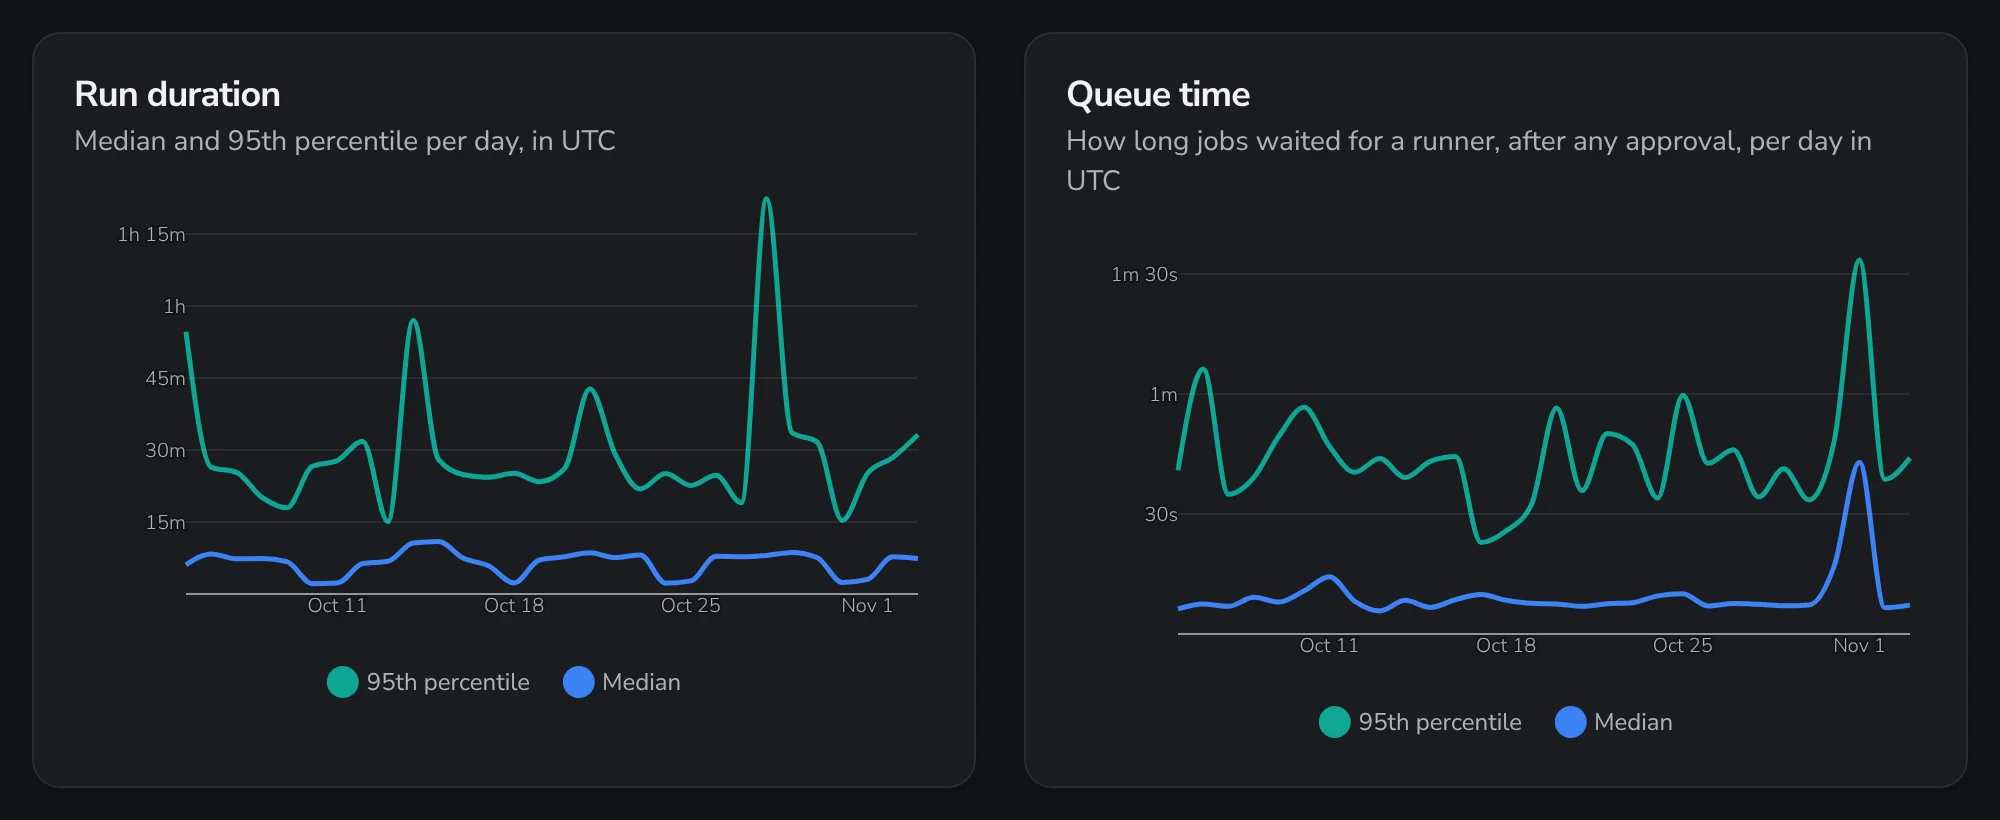
Dashboards for reliability, performance and usage show when your pipelines start to take longer, wait longer for a runner or fail more often. Look at the last week, month or quarter, across all projects or just one pipeline.
- Median and slowest run times per day
- Success rate, flaky re-runs and the steps that fail most
- CI minutes per pipeline and when during the week they run
How it works
Up and running before your next build
- 01
Sign up
Register with GitHub, Google or your email address.
- 02
Connect GitHub
Install the pipescan GitHub App on your account or organization, for the repositories you choose.
- 03
Get your insights
Every workflow run shows up as soon as it starts. No changes to your workflows, nothing to install on runners.
Only timings, never your code
pipescan reads the names, results and timestamps of your workflow runs, jobs and steps. It doesn't read your source code or your logs.
Leave whenever you like
Disconnect GitHub, or delete your account together with all its data, from your settings at any time.
GitHub Actions today. GitLab CI, Jenkins and more are on the roadmap.
Free beta
What the beta includes
- 1 GitHub repository of your choice
- The last 30 days of runs, imported when you connect it
- Run timelines and the critical path of every run
- Pipeline history and dashboards for reliability, performance and usage
- Deployments, pull requests and the live view of running workflows
- A direct line to us for bug reports and feature requests
The beta is free and needs no credit card.